Appearance
区域热力图
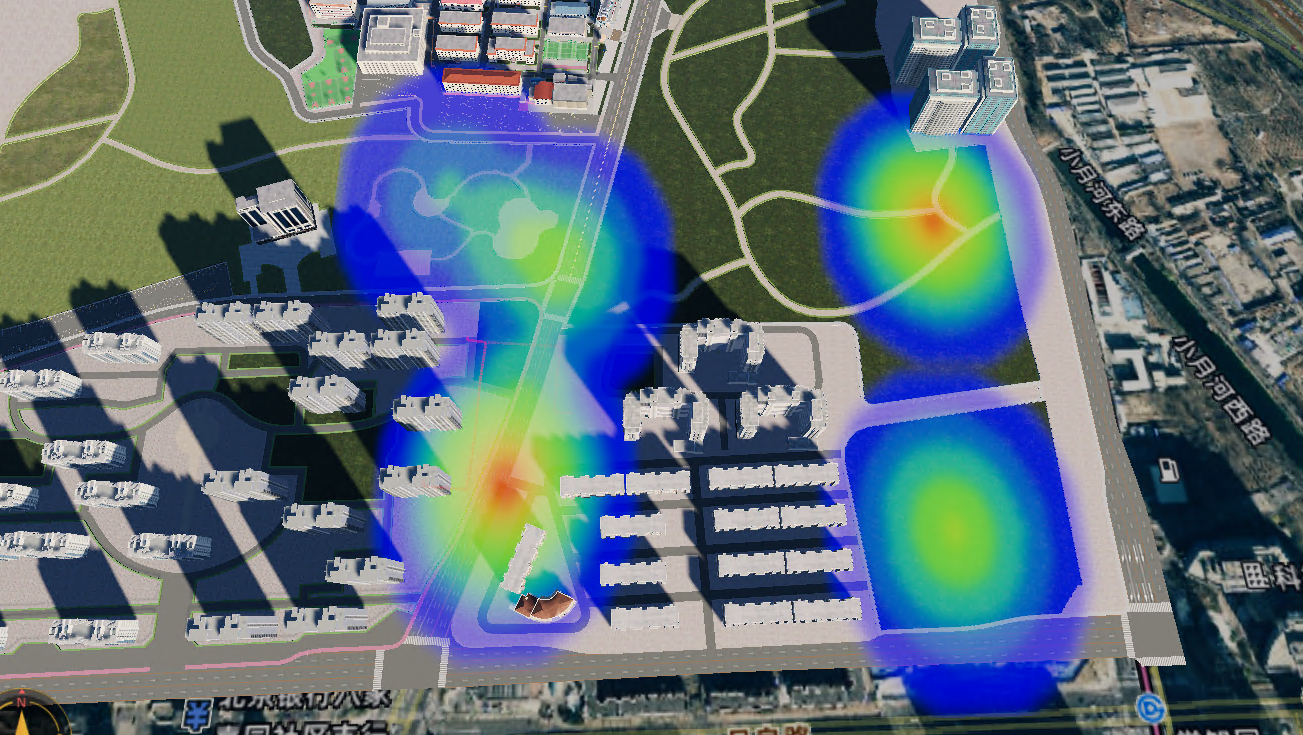
区域热力图,根据区域内的点的数量,来显示热力图的大小。
支持点的颜色渐变,支持点的大小渐变,支持点的透明度渐变。
添加区域热力图示例
js
const params = {
  data: [
    {
      displayModel: true,
      elementData: {
        _drapeMap: 0,
        _blurValue: 3,
        _blendValue: 128,
        _pixelRadius: 20,
        _flyToModel: false,
        _heatMapValueRange: {
          x: 1,
          y: 100,
        },
        _isNewAdd: false,
        _logState: true,
        _modelType: 0,
        _pColorLevels: [
          {
            w: 1,
            x: 0,
            y: 255,
            z: 0,
          },
          {
            w: 1,
            x: 0,
            y: 255,
            z: 255,
          },
          {
            w: 1,
            x: 255,
            y: 0,
            z: 0,
          },
        ],
        _points: [
          {
            w: 1,
            x: 116.40229045458494,
            y: 39.9094914933332,
            z: 0.21468749176710844,
          },
          {
            w: 50,
            x: 116.40277529839895,
            y: 39.91026519723265,
            z: 5,
          },
          {
            w: 100,
            x: 116.40234221091661,
            y: 39.91097423841769,
            z: 5,
          },
        ],
      },
      name: "区域/密度热力图",
    }
  ]
};
cloudObj.RtAPI("addHeatMapsArea", params, (res) => {});效果图